One of the most frustrating problem for a developer is when something comes between the machine and the ability to write code. IDEs are notorious in this aspect and we all have a love-hate relationship with them. Unfortunately, for iOS/OSX developer there aren’t many options to explore from except Xcode. So what to do when Xcode limits your ability to write code? Instrument it!
I am running Xcode version 7.0.1 (7A1001) on OS X version 10.10.5. Hardware is MacBook Pro (Retina, 15-inch, Early 2013) with 2.7 GHz Intel Core i7 and 16 GB 1600 MHz DDR3.
The problem
Lately I was experiencing slow file switching in Xcode while working on a project. The project is a big one with lot of pods and has approximately 2000+ classes written in Objective-C. It was taking more than 2 seconds to switch between files. Even opening the corresponding .m or .h file was taking a lot of time. I was suspecting the large size of the project but the culprit was code coverage reports and here is how I investigated it.
Learn more about setting up code coverage for Xcode.
Strategy
Usually, such problems with Xcode just go away by cleaning the build or deleting the ~/Library/Developer/Xcode/DerivedData subfolder(s). But first, I wanted to investigate why exactly is Xcode slowing down. I wanted to see what is Xcode doing all this time when I open a code file.
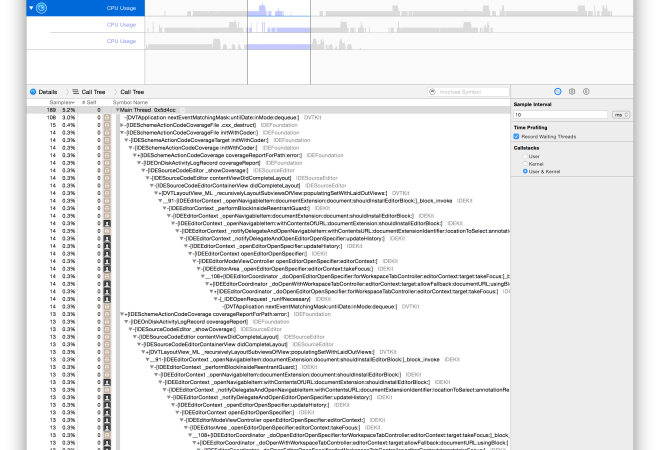
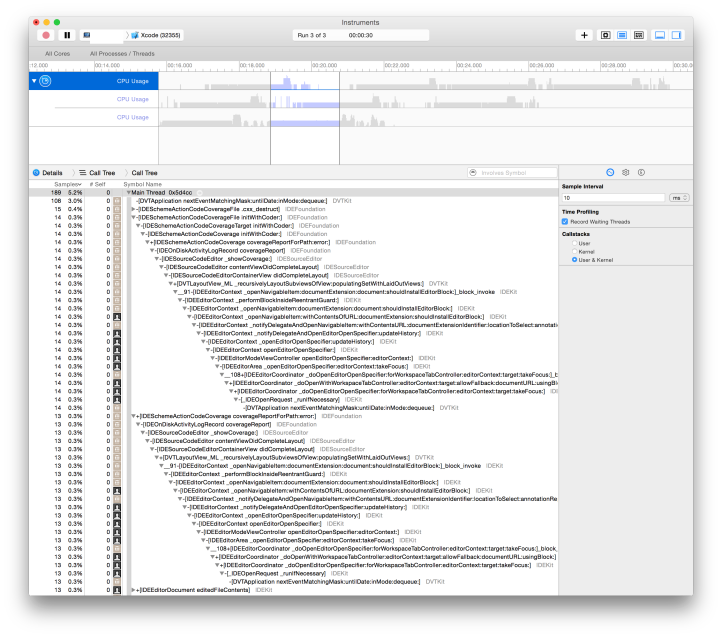
I fired up Instruments with Time Profiler and attached it to the running instance of Xcode. Once I hit the record button, I switched between several files in Xcode Navigator. Here is the screenshot for Instruments report.
I selected a time range for a single file open action (the repeating pattern you see is file switch operations. There are three rows because I sampled 3 times) to see what goes inside it. You can try different settings to suit your need but usually inverting the call tree helps.
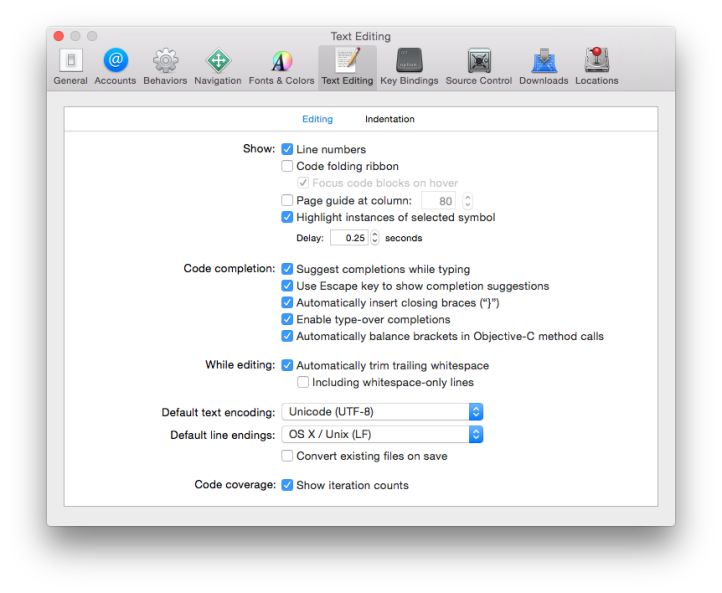
It turned out that Xcode is spending a lot of time reading the Xcode Test Coverage Reports. See it on top of the call tree as IDESchemeActionCodeCoverageFile class. There is a whole bunch of Code Coverage related work going on. Look deeper and notice that its the Source Editor that is trying to get the coverage data. This is because I was tinkering with the IDE Text Editing settings in Xcode, I turned on the option to “Show iteration count” for code coverage (at the bottom). This option shows in the right gutter of the text editor the coverage information.
The reason why Xcode is slowing down is because its trying to open/parse the code coverage report every time I switch to another file and tries to display the coverage information.
It turns out disabling this option does not fix the problem.
There are several other places where code coverage is mentioned so I also tried disabling the Project > Build Settings > Code Generation option to “Enable Code Coverage Support”.
It turns out disabling this option also does not fix the problem.
One last place to disable coverage is in the Scheme > Test settings.
Turning this off did not fix the problem either.
Finally, I resorted to zapping the DerivedData folder (I have a handy short cut on my Finder side bar for it) and voila, the problem was solved. Xcode keeps several files generated to support code coverage in there and this resets everything. Now my Xcode is faster.
Are you experiencing slow Xcode? Perhaps run it through Instruments and see what is going on. There is a good tutorial on Instruments here. You can read the official Apple guide about Instruments here.
Update: This issue reappeared after a couple of days. I suspect the test-coverage to Code Editor binding is not immediate for some reason. YMMV.
#instruments, #profiling, #xcode


sorry is not work for me,i use a ramdisk for DerivedData,sometime is still suck.
LikeLike
I have noticed you don’t monetize your page, don’t waste your traffic, you can earn additional cash every month because you’ve got
high quality content. If you want to know how to make extra bucks, search
for: Boorfe’s tips best adsense alternative
LikeLike